Immersive Dashboard
Designed to improve visitor interactions
with patient information in healthcare facilities
About the Project
eliXR is an interactive digital product designed for kiosks within hospital facilities that reduces the need to track down healthcare workers at the hospital - empowers patients and visitors to see their own information and understand it with the help of VR and accessible design.
Initial Concepting
-
Our team came together with the common interest in healthcare systems. In initial brainstorming sessions, we wanted to emphasize the use of immersive technology in dashboards for healthcare data.
-
We conducted preliminary research to understand our users and their pain points.
-
We then completed competitive analysis and preliminary research. We found that existing information systems and dashboards catered to healthcare administration and medical professionals – not patients and their visitors. Additionally, when information is relayed between healthcare staff and patients, it is often confusing.
-
We thus decided to work on a solution that could use immersive VR technology to enhancing the hospital experience of a visitor or a caretaker by visualizing information.
Project Timeline
12 Weeks
August-December, 2022.
UX Disciplines
Interaction Design
UX Design
UX Research
Usability Studies
Team
Hyojeong Kim
Liz Bender
Prachi H Modi
Varsha Revandkar
Xueqing Wang
My Role
Research: Conducting competitive analysis, moderated usability tests by curating test plans, data analysis through affinity mapping, drawing information architecture and proposing design solutions, understanding HIPPA compliance in design and accessibility.
Design: Wireframing, storyboarding, prototyping and mockups. Brainstorming Visual Design and aesthetics, for accessibility.
Roadmap to our approach

User & Stakeholder Research
Competitor Analysis
01
Epic
Electronic medical record system used by more than 250 health care organizations nationwide.
-
Appointment Management
-
Billing Management
-
Document Management
-
Reporting and Analytics
-
Scheduling
02
My Chart

MyChart puts your health information in the palm of your hand and helps you conveniently manage care for yourself and your family members.
-
Connecting and Sharing
-
Health
-
Messaging
-
Scheduling And Appointments
-
Payment and Insurance
User Research

IDENTIFIED USER GROUPS
Vistors
What would some visiting a visiting a patient in a medical facility want to know? As a caretaker, guardian, relative, friend, or next of kin?
NO OF PARTICIPANTS
10 Participants

Patients
What would a patient want to know about their own healthcare experience? Do they care about this information if they’re “out of it”?

Medical Staff
What kinds of information systems do healthcare workers already use ? how could they be improved?
10 Participants
10 Participants
INSIGHT HIGHLIGHTS
Medical records shared are hard to keep a track of. A consolidated platform that has all information stored for future reference would be quite convenient.
There isn’t a doctor available all the time to answer any questions in case of any emergencies, even if there are, sometimes I have obtained different answers to the same questions
Medical diagnoses can be very complex topics, and patients sometimes can only understand the surface of it. It can take many conversations over days to get on the same page.

USER PERSONA
IDENTIFYING TARGET USERS
Visitors identified as target audience

From our follow up interview, we inferred that visitors would utilized our tool more than patients or medical care providers.
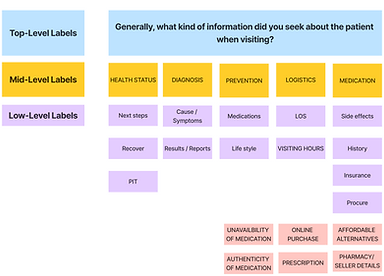
Affinity mapping for target users: Visitors

Insights of affinity mapping

User Journey of Visitors

Information Architecture

Based on all the information we have, we created the information architecture to decide the features and feature hierarchy of our products
User Testing
Testing Methodology
01
SCREENING
PARTICIPANTS
Prospective participants screened through surveys, who possibly fit into one of the following user groups:
-
Patients
-
Visitors
-
Medical care staff
Received 80 responses
02
RECRUITING
PARTICIPANTS
Shortlisted participants from screener survey responses for all 3 user groups.
These participants filled up a follow-up survey for us to gauge their expectations from such a tool in the capacity of the group they represented.
Target Users found to be Visitors.
03
CONDUCTING
USER TESTS
We conducted in-person/ online user tests with a moderator script. We asked the participants to perform 3 tasks and took notes of their performance. We also asked them to fill a SUS post each test
04
ITERATING
DESIGNS
On the basis of the feedback we received from our user tests, we iterated our prototypes to cater to the needs of our users.
05
TESTING
ITERATIONS
Conducted 3 rounds of user tests with visitor user groups using different fidelity levels of prototypes:
-
Low-Fidelity Prototype
-
Mid-Fidelity Prototype
-
High-Fidelity Prototype
Testing Overview
Demographics
With visitors are target audience, user group comprised of people in the age category ranging from early 20’s to 50’s.
Scenario
‘Your name is Emma Haynes. Your father, Frank, whom you are very close with, has been diagnosed with a few conditions. He has been in the hospital for a few days due to his atherosclerosis, and you are going to visit him.’
01
ROUND 1: Lo-Fidelity Prototype
8 USERS
3 TASKS
Task 01:
Check Frank’s diagnosis and Symptoms
Task 02:
Understand Frank’s recommended treatment
Task 03:
View Frank’s outstanding bills
02
ROUND 2: Mid-Fidelity Prototype
6 USERS
3 TASKS
Task 01:
Check the severity of Frank’s diagnosed condition
Task 02:
Understand Frank’s recommended lifestyle changes
Task 03:
Check what appointments Frank needs to make.
03
ROUND 3: High-Fidelity Prototype
4 USERS
3 TASKS
Task 01:
Check the details of Frank’s current medication
Task 02:
Understand Frank’s progress report timeline
Task 03:
Check Frank’s appointment schedule for 23rd November
Design
Design Process & Concept
For this step, our team work on various activities, from conducting user interview, creating information architecture to transfer high fidelity design. The design process included:
Sketching
Creating wireframes
Creating prototypes
Creating design systems


.png)
.png)

Design Solutions and Testing Implementations
ROUND 1: Lo-Fidelity Prototype
User Insight Highlights
-
New users seemed like the only CTA
-
Did not understand where to scan below due to prototyping tool constraints

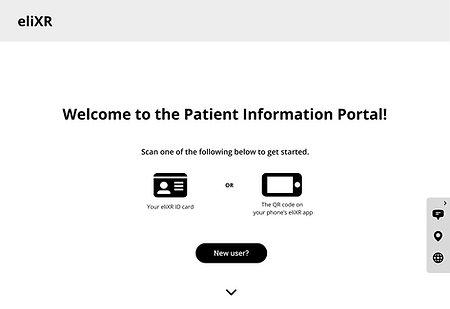
ROUND 2: Mid-Fidelity Prototype
User Insight Highlights
-
The small arrow was not intuitive to proceed ahead
-
Confused about whether to click the icons or arrow
-
Were not able to associate icons on the right floating bar with their intended functions
.png)
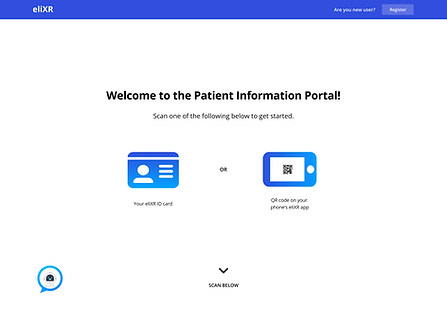
ROUND 3: High-Fidelity Prototype
Final design solution
-
For our final prototype we made sure that the every visual representation/ iconography was adequately annotated
-
We made the chatbot feature more prominent to prompt users to make use of it if in doubt.

Final Prototypes

Key Takeaways and Next Steps
01
NEED MORE USER TESTS TO MAKE MORE INFORMED DECISIONS
Iterate and conduct user tests with more
diverse backgrounds
(age, occupation, e.g.)
02
CURRENT VERSION FOCUSES ON VISITORS/KIOSK ONLY, NEEDS TO DIVERSIFY
Develop healthcare staff version of dashboards and the mobile version of the app
03
NEED TO CONSIDER WORKABILITY WITH CURRENTLY USED SYSTEMS
Consider hypothetical scenarios such as acquisition of MyChart, integration with Epic
04
UNDERSTAND AND STUDY HEALTHCARE PROVISION RULES AND REGULATIONS BETTER
Research on HIPAA and such procedures as needed
05
CONSIDER HOW INNOVATIVE TECHNOLOGY CAN BE INTEGRATED TO MAKE THE TOOL MORE EFFICIENT
Further develop immersive capabilities and research the physical aspect of incorporating VR/


